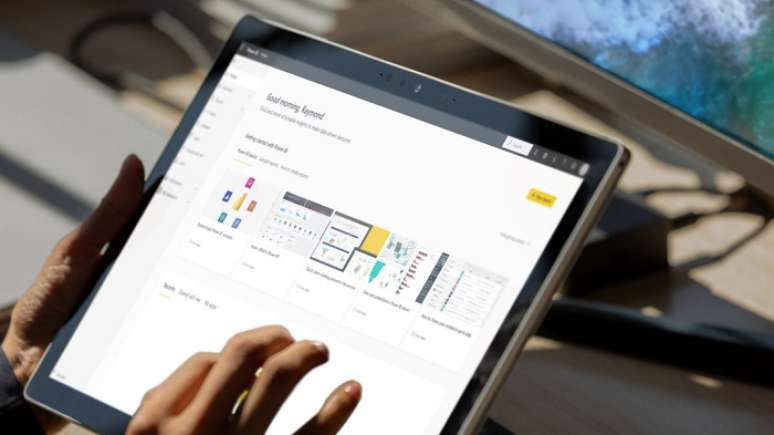
In addition to providing information such as the date and time of the festivities, the project has maps showing the location of more than 700 carnival blocks.
Those who live in São Paulo or Rio de Janeiro and enjoy a good party will be able to plan their Carnival celebrations even better this year. Using Microsoft’s Power BI, graduate student Wendela Sara, an economics student at the Fluminense Federal University (UFF), created a blueprint with information and the location of more than 700 street blocks in both cities.
The initiative was carried out with the help of the student’s girlfriend, friends and family, who doesn’t study or work with coding, but was curious to explore the potential of tools like Microsoft’s.
The young woman, born in São Paulo, but living in the capital Rio de Janeiro for eight years, then had the idea of using technology to create a map that would facilitate the consultation of carnival events in the capitals.
“What I did was look at the blocks in the Official Gazette and enter the information into Power BI, which automatically filled in the data and did the categorization. A friend helped us with the layout, but it was all very easy and fun to Do”explains.
How to query the project
The data entered by Wendela and compiled and organized by the tool then allowed the creation of the Carnival BI, the “first Power BI of Carnival 2023”; page available online for anyone who wants to consult it.
In it you can locate more than 400 blocks from Rio de Janeiro and 300 from São Paulo, filtering your search by date, name, city region and even musical style. That’s all, of course, plus the search bar itself, where you can make a direct query on any spree.
As a result, the person has access to an interactive map showing where the selected parts are located. And, in addition, a table showing results such as date, day, time, block name, region and concentration of events.
The Microsoft platform offers data insights

Launched in 2015 by Microsoft, one of the largest IT and technology companies, Power BI is a platform that organizes and connects the data provided by the user, creating insights and dashboards with intelligence tools based on this information.
With it, for example, you can generate reports about your business, detecting trends that help you make better business decisions. And all this without necessarily having in-depth knowledge of programming, analysis or statistics.
“We want everyone to be able to use Microsoft tools to solve challenges by simply clicking and dragging components across the screen, without the need for coding or programming knowledge”explains Marcondes Farias, product director for Dynamics 365 and Power Platform at Microsoft Brazil.
In addition to the free basic version, the service also includes a Pro plan and a corporate version, and is accessible both via the web and from mobile devices (iOS and Android).
College student uses Microsoft Power BI to catalog city blocks in SP and Rio
Source: Terra
Rose James is a Gossipify movie and series reviewer known for her in-depth analysis and unique perspective on the latest releases. With a background in film studies, she provides engaging and informative reviews, and keeps readers up to date with industry trends and emerging talents.


