Discover the seven indicators used by scientists to monitor the evolution and state of the global climate system.
Surely you have heard the messages from the United Nations warning the world of the danger of global warming. But do you know how the drug behind these warnings is produced?
In total, scientists use seven indicators to monitor the evolution and state of the global climate system. These indicators constitute key information to describe climate change.
The methods applied in this process range from observations on the sea floor to the upper atmosphere.
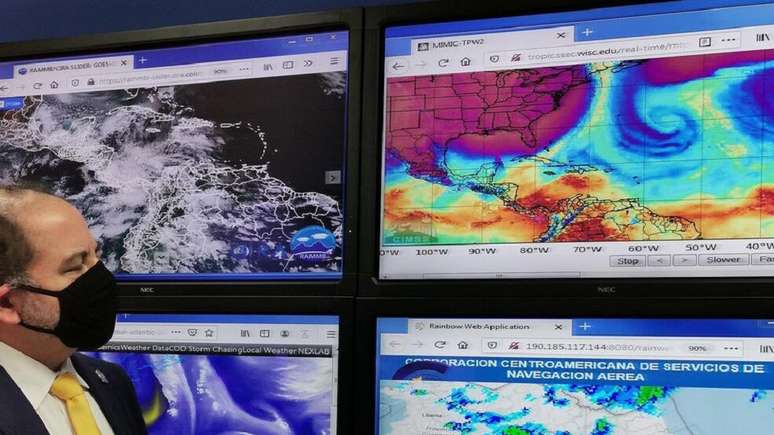
Discover the science behind global warming warnings (Photo: WMO – UN Costa Rica/Danilo Mora)
1 – Average surface air temperature
The first important indicator is the average surface air temperature. To generate this information, a combination of the air temperature about two meters above the surface of the land and that of the sea is made, using information from measuring stations around the world and climate reanalysis models.
It is on the basis of six global temperature data series that the WMO calculates the anomaly and the annual ranking. 2023 will be the warmest year on record. Measurements began in 1850.
Furthermore, the last nine years, from 2015 to 2023, have been the warmest.
2- Heat content of the ocean
The second indicator is the heat content of the ocean. This measurement is carried out at various depths, reaching up to 2 thousand meters. All databases indicate that the rate of ocean warming has increased dramatically over the past two decades at all depths.
The ocean has absorbed and retains approximately 90% of the excess heat due to the increase in the human-caused greenhouse effect. The latest consolidated information available, referring to the year 2022, reveals that the heat content of the ocean has reached a new record this year.
3- Sea level rise
Another element observed is the rise in sea levels, which occurs constantly. Between January 1993 and October 2023 the sea rose by more than 10 cm, reaching a record value in 2023.
Furthermore, there is an acceleration, as the rate of average sea level rise over the past decade is more than double that recorded between 1993 and 2002.
Projections indicate that the increase will continue at an increasingly rapid rate, largely due to warming oceans and melting glaciers and ice caps.
At the current rate, the melting of Greenland and Antarctica could contribute to average sea level rise by almost a meter this century, under a scenario of high greenhouse gas emissions.
4- Glacial mass
The fourth indicator is ice mass. So-called glaciers, or glaciers, are a large mass of ice that can take up to 30,000 years to form. They are present in various parts of the planet, especially on top of the highest mountains. Glaciers store 70% of the planet’s fresh water.
Since the 1970s there has been an average decrease in the thickness of these glaciers of over 30 metres.
In August 2023, a new altitude record for the point in the atmosphere where water freezes was recorded in Switzerland, which amounted to 5,298 meters. This is much higher than the highest mountain peaks in Europe, such as Mont Blanc, which is 4,811 metres.
5- Sea ice extent
The fifth measurement is sea ice extent. New data shows that in September this year Antarctic sea ice was 1.5 million km2 smaller than average, an area roughly equal to the area of Portugal, Spain, France and Germany combined.
It is good to remember that ice also has the role of reflecting sunlight, so as the planet’s ice layer reduces, more heat is retained and this further accelerates the melting of the remaining ice.
6 – Acidification of the oceans
The sixth indicator observed is ocean acidification. The seas absorb approximately 23% of annual man-made emissions of carbon dioxide, CO2, but they pay a high ecological price for this.
CO2 reacts with seawater, increasing its acidity and this puts living organisms at risk, also affecting fishing and aquaculture. This also affects coastal protection by weakening coral reefs, which act as a barrier to the coast.
7 – Concentration of greenhouse gases
Finally, the composition of the atmosphere is analyzed. And what is most alarming in this sense is the increase in the concentration of gases that cause the “greenhouse effect”, that is, they retain heat.
The emission of these gases has increased dramatically due to human activities since the beginning of the industrial era and this is the main reason identified by scientists for the climate changes we are experiencing today.
The main greenhouse gas is CO2. Some is absorbed by forests and seas, but nearly half remains in the air and takes many years to dissipate.
The last time Earth recorded a comparable concentration of CO2 was 3 to 5 million years ago, when temperatures were 2 to 3°C warmer and sea levels were 10 to 20 meters higher than the current one.
At that time there was only the emission of CO2 through natural processes. Today, CO2 emissions generated by man, although lower than those deriving from natural processes, cause an excess that cannot be absorbed, generating a fatal imbalance.
Data from reference institutions
A The World Meteorological Organization uses datasets from multiple reference institutions and international research centers, including global temperature data from six institutions that are references in climate monitoring.
The first of these is the National Aeronautics and Space Administration of the United States, NASA. This agency has at least 42 satellites and space instruments dedicated to measurements related to the Earth’s climate.
The second reference body is the National Oceanic and Atmospheric Administration of the United States, Noaawhich owns or operates 17 satellites, 1,322 marine buoys, 15 ships and 9 aircraft to monitor the weather.
In addition, the agency organizes a database with records from more than 100,000 weather stations from 180 countries and territories.
The third data source is the MetOfficethe national weather service of the United Kingdom, founded in 1854. The English center is a point of reference for its technological capacity based on the use of supercomputers to make weather forecasts and climate change projections.
The fourth is the European Weather Forecasting Centre, Ecmwfwhich operates one of the best performing weather forecast models globally and the ERA5 reanalysis model, which integrates atmospheric, land and ocean variables, with high spatial and temporal resolution.
The fifth source of the WMO is the Berkeley Earth Groupan independent scientific organization specializing in data science, which studies trends, performs statistical analyzes and simulations with information from weather stations around the world.
The sixth source is the Japan Meteorological Agency, JMAwho developed the third generation reanalysis model, JRA55, which was the first of its kind to make information available since the late 1950s.
Scientific consensus
Furthermore, meteorology is one of the disciplines in which there is long and successful international cooperation. Observing systems, including stations around the world, must follow and operate according to rigorous specifications to generate uniform, reliable and robust data.
The WMO global observation system currently has more than 11,000 ground stations, about 4,000 on board ships, more than 1,200 buoys on the sea surface, sending observation data in real time, as well as various satellites, aircraft, radar and atmospheric electrical discharge detectors, among others.
All this information sharing that comes from these observation stations and means feeds the databases and climate models that are used in rigorous studies of the causes of the current warming of the planet.
That’s why, according to NASA, 97% of climate scientists actively developing and publishing studies agree that humans are causing global warming and climate change.
Source: Terra
Rose James is a Gossipify movie and series reviewer known for her in-depth analysis and unique perspective on the latest releases. With a background in film studies, she provides engaging and informative reviews, and keeps readers up to date with industry trends and emerging talents.


